Richest Cities in Colorado (2026)
by Kristen Carney
Updated: February 9, 2026
Richest City in Colorado
The richest city in Colorado is Cherry Hills Village with an average household income of $486,925 as of 2024 and 6,354 people as of 2024 according to the most current Census data available (citation).
| Rank | City | County | Population | Average Income | Median Income |
|---|---|---|---|---|---|
| 1 | Cherry Hills Village | Arapahoe | 6,354 | $486,925 | $250,001 |
| 2 | Castle Pines Village | Douglas | 4,436 | $436,644 | $250,001 |
| 3 | Franktown | Douglas | 472 | $424,012 | $250,001 |
| 4 | Columbine Valley | Arapahoe | 2,047 | $392,407 | $250,001 |
| 5 | Crisman | Boulder | 268 | $387,794 | $172,574 |
| 6 | Bow Mar | Arapahoe; Jefferson | 1,047 | $355,944 | $241,583 |
| 7 | Upper Witter Gulch | Clear Creek | 731 | $284,081 | $250,001 |
| 8 | St. Ann Highlands | Boulder | 453 | $272,747 | $188,125 |
| 9 | Coaldale | Fremont | 538 | $268,848 | -$1 |
| 10 | Greenwood Village | Arapahoe | 15,420 | $266,726 | $149,029 |
| 11 | Sterling Ranch | Douglas | 4,213 | $264,954 | $206,719 |
| 12 | Timnath | Larimer; Weld | 8,941 | $263,653 | $178,257 |
| 13 | Genesee | Jefferson | 3,778 | $250,878 | $186,667 |
| 14 | Foxfield | Arapahoe | 659 | $236,413 | $200,938 |
| 15 | The Pinery | Douglas | 11,871 | $234,837 | $194,446 |
| 16 | Cherry Creek | Arapahoe | 10,721 | $231,578 | $153,776 |
| 17 | Perry Park | Douglas | 1,570 | $229,412 | $158,214 |
| 18 | Kittredge | Jefferson | 812 | $228,946 | $222,500 |
| 19 | Stepping Stone | Douglas | 3,137 | $227,949 | $223,839 |
| 20 | Paragon Estates | Boulder | 667 | $219,001 | $230,268 |
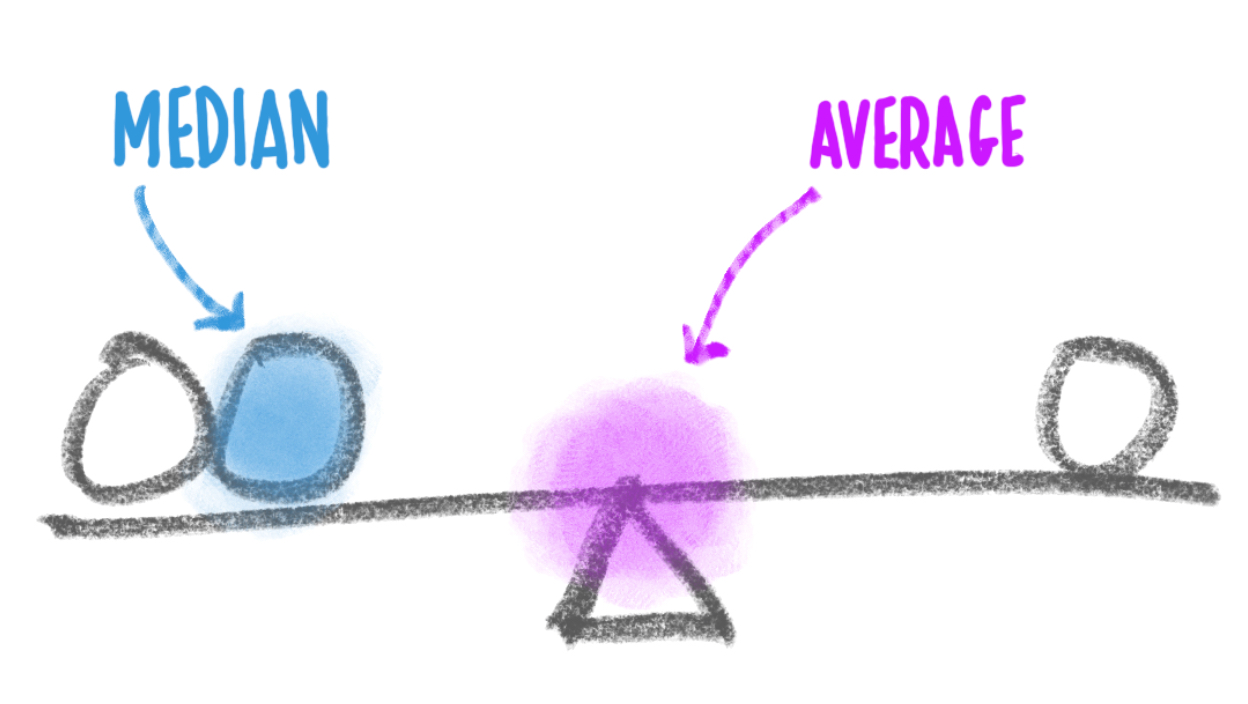
Median Income versus Average Income: Which Should You Use?
We usually suggest using median income data – either instead of or in addition to – average income data as a true indicator of wealth. If you haven’t thought about median versus average since your last standardized test, you aren’t alone. Here’s what they are:
- average is the sum of a set of numbers divided by the count of numbers in the set
- median is the middle number in the set of numbers
Now let’s say you had the following simplified set of income data.
Household 1: $30,000
Household 2: $50,000
Household 3: $1,000,000
The average income for this set is $360,000. The outlier data point ($1,000,000) skews the average WAY up. Conversely, the average income would be skewed WAY down if someone had an income of $500. The median income for the same data set is $50,000. Outlier data doesn’t skew the median.
Most Business Owners Should Use Median Income
So most business owners should use the median income as a true indicator of wealth, because it provides a more accurate representation of a typical income, especially in areas with significant income disparity.
When Should You Use Average Income
If your target market is high-income households, the average income may be more relevant. This is because the average income can highlight the presence of a higher concentration of wealthy individuals, which is beneficial for luxury goods and services marketing. We’re using average income on this page because using the Census’s highest reported median value of $250,001 could result in multiple ties for the richest geography.
Why do so many cities have a median value of $250,001?
The Census' American Community Survey uses $250,000+ as a jam value for median income estimates to protect privacy, ensure data consistency, and simplify reporting. A "jam value" in survey data refers to a placeholder or default value used when actual data points are unavailable, incomplete, or exceed certain thresholds. We represent this jam value as $250,001 to make it easy for you to sort.
You might also be interested in:
Email Me When New Data Are Released
Join thousands of subscribers and receive just 1 (ONE!) email a year in December when the US Census Bureau releases new income data for Colorado richest cities.
SOURCES
United States Census Bureau. Annual Estimates of the Resident Population: April 1, 2020 to July 1, 2023. U.S. Census Bureau, Population Division. Web. May 2024. http://www.census.gov/.
United States Census Bureau. B01001 SEX BY AGE, 2024 American Community Survey 5-Year Estimates. U.S. Census Bureau, American Community Survey Office. Web. 29 January 2026. http://www.census.gov/.
United States Census Bureau. B19013 Median Household Income, 2024 American Community Survey 5-Year Estimates. U.S. Census Bureau, American Community Survey Office. Web. 29 January 2026. http://www.census.gov/.
United States Census Bureau. "DP03 SELECTED ECONOMIC CHARACTERISTICS." 2024 American Community Survey 5-Year Estimates. U.S. Census Bureau, American Community Survey Office. Web. 29 January 2026. http://www.census.gov/.
Products & Services
Plumbing
Connect
- 1-800-939-2130
- Contact Us
© Copyright 2026 Cubit Planning, Inc.